How Big Is the Gap Between Colorado River Promises and Actual Flow?
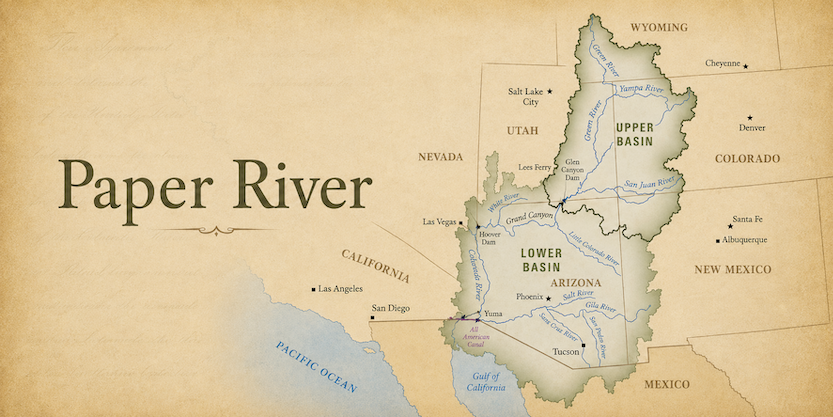
The Law of the River promised more Colorado River water on paper than the river has ever consistently delivered.
Over a century of flow records now shows that the river’s long‑term supply has consistently lagged behind the legal entitlements carved up during an unusually wet period in the early 1900s. Since 2000, a hotter, drier climate has further reduced average flows and driven the basin into the driest multi‑decade stretch in at least a millennium. At the same time, total human consumption and system losses remain higher than what the river can sustainably provide.
Key Takeaways
- Over the full record from 1906 to 2024, natural flow at Lees Ferry averaged 14.6 million acre-feet (MAF), but since 2000, a prolonged “hot drought” has cut that average to about 12.4 MAF (an 18% deficit).
- The Law of the River allocates about 16.5 MAF annually, exceeding the river’s 14.6 MAF long‑term average.
- Agriculture dominates human use of the Colorado River, with irrigation accounting for 52% of overall water consumption and 74% of all water directly consumed by people (including farms, cities, and industry). Within that, recent work by Brian Richter and colleagues estimates that on the order of 55% of total Colorado River water use is tied to livestock feed.
A new report by Healthy Green Spaces Coalition analyzes the evolution of the Colorado River by comparing historical and recent hydrologic data with the legal framework that governs its water. As basin states negotiate new post‑2026 operating rules, these numbers underscore the need to find more durable ways to match legal promises with what the river can realistically provide, instead of depending on repeated short‑term emergency measures.
As water policy expert Mark Reisner famously put it in Cadillac Desert, the Colorado River does not have a “water supply problem” so much as an “allocation problem.” We are using scarce water to grow many crops, especially livestock feed, that could be produced elsewhere in the United States, but we remain locked in an outdated legal paradigm for how we share and prioritize that water.
Water Allocation by State
The 1922 Colorado River Compact and subsequent statutes and agreements (collectively the “Law of the River”) allocated more water on paper than the river’s long-term average flow has provided in practice.
That over‑allocation is at the center of today’s legal and political conflict. The 2007 Interim Guidelines and related shortage‑sharing agreements expire in 2026, negotiations over new rules are stalled, and both Upper and Lower Basin states are preparing for possible Supreme Court fights over how to interpret the 1922 Compact in an era of declining storage.
- Foundational over-allocation: Compact negotiators assumed an average annual flow of 16.4 MAF and apportioned 7.5 MAF each to the Upper and 8.5 MAF to the Lower Basins. The later 1.5 MAF treaty obligation to Mexico brought total legal entitlements to about 16.5 MAF—well above the observed long-term average flow of 14.6 MAF. Historical research synthesized in Science Be Dammed by Eric Kuhn and John Fleck shows that negotiators had access to data suggesting a lower long‑term yield, yet chose to divide a larger “paper river” because it was politically easier to allocate a big pie than a small one.
- Lower Basin allocations (fixed): Lower Basin states hold fixed annual apportionments: California (4.4 MAF), Arizona (2.8 MAF), and Nevada (0.3 MAF). Under the 1968 Colorado River Basin Project Act, Arizona and Nevada are junior to California and therefore face curtailments first when Lake Mead elevations trigger Tier One and Tier Two shortage conditions. These priority rules are currently guiding who takes cuts, but they are also the subject of intense negotiation; as Dr. Jack Schmidt, Director of the Center for Colorado River Studies at Utah State University notes, in a system this stressed, all Lower Basin users ultimately face the need to share shortages more broadly rather than relying on a narrow set of junior rights holders.
- Upper Basin allocations (percentage-based): Upper Basin states divide their share by percentage to reflect hydrologic uncertainty: Colorado (51.75%), Utah (23%), Wyoming (14%), and New Mexico (11.25%). They must also collectively ensure that at least 7.5 MAF is delivered to the Lower Basin over each consecutive 10‑year period. An obligation that, as Dr. Schmidt emphasizes, becomes increasingly uncertain under climate change, and that many Upper Basin leaders do not interpret as a fixed volume they “owe” the Lower Basin.
The Compact requires that Upper Basin uses “shall not cause” flows at Lees Ferry to fall below certain thresholds. Dr. Schmidt argues that in a warming climate, Upper Basin states read that clause as a limit on their responsibility rather than a fixed delivery obligation, and warns that this interpretation “will just make work for lawyers.”
In the Lower Basin, water master accounting generally emphasizes diversions minus return flows. In the Upper Basin, mainstream reservoir evaporation and channel losses are explicitly charged against total water use; between 2016 and 2020 these losses accounted for roughly 10% of Upper Basin consumptive uses and losses.
Colorado River Flow and Use
The Colorado River has shifted from a period of perceived abundance to a persistent structural deficit. Consumptive use and system losses, meaning primarily irrigation, municipal and industrial use, plus reservoir evaporation and riparian/channel evapotranspiration, reliably exceed natural runoff.
- Flow decline: From 1906 to 2024, the natural flow at Lees Ferry averaged about 14.6 million acre-feet (MAF) annually. In the 21st century, natural flow has been roughly 13–18% lower (on the order of 2–3 MAF less each year) during what Jack Schmidt and colleagues describe as a prolonged hot drought overlaying a warming climate. Their recent analyses suggest that stabilizing reservoir storage under these conditions will likely require reducing basin‑wide consumptive use by roughly 3–3.5 MAF per year relative to recent practice.
- Supply–demand imbalance: While basin‑wide natural flows have averaged about 12–13 MAF in the 21st century, total consumptive uses and losses, including reservoir evaporation, between 2000 and 2019 are estimated at roughly 19 MAF per year. This persistent gap has been covered by drawing down storage, especially in Lake Powell and Lake Mead, rather than by bringing uses in line with supply.
- Hydrologic volatility: Recent years have featured extreme “whiplash” conditions. In 2021, natural flows were very low at roughly 7.8 MAF; in 2023 they exceeded 17 MAF, before dropping back toward the mean in 2024 at about 12.1 MAF. The 2022 – 2023 wet year provided only a partial, temporary rebound and did not erase the long-term deficit.
Main Uses of Colorado River Water
The Colorado River underpins a wide array of economic, municipal, and ecosystem services and supplies water for nearly 40 million people in the United States and Mexico.
- Agriculture (primary use): Most Colorado River water consumed by people is used in agriculture, and recent analyses by Dr. Jack Schmidt and Brian Richter indicate that on the order of 55% of total Colorado River use is tied to livestock feed crops such as alfalfa and hay, not to fruits and vegetables. It is useful to distinguish between large, water‑intensive livestock‑feed acreages, often in hot desert climates, and smaller but higher‑value plantings of fruits, vegetables, and specialty crops that contribute more directly to food security. Even as many big cities have cut per‑person water use, farming still dominates, showing that current patterns reflect old legal rules more than best use of a limited supply.
- Municipal and industrial (M&I): Municipal and industrial demands account for roughly 15–20% of basin water use, supplying major cities both within and outside the watershed—such as Los Angeles, Phoenix, Denver, and Salt Lake City—through large aqueducts and transbasin diversions. Over the past two decades, many large metropolitan areas have significantly reduced per‑capita water use, so total urban demand in some big cities has flattened or even declined despite population growth, while many mid‑sized communities still have considerable room to reduce per‑capita use.
- Hydropower: River infrastructure provides up to approximately 4,200 megawatts of installed generating capacity across multiple dams, including Hoover and Glen Canyon Dams. Historically, Hoover and Glen Canyon each generated on the order of 4–5 billion kilowatt‑hours annually, and both facilities were central to meeting peak electricity demand through hydropower peaking operations. Declining reservoir elevations now constrain that role: at Glen Canyon Dam, Reclamation’s 2024 Record of Decision indicates a management target of keeping Lake Powell above about 3,500 feet to protect turbine operation and dam infrastructure, while similar guidance aims to avoid Lake Mead dropping below 1,000 feet.
- Other beneficial uses: Additional uses include mineral production (oil, gas, and coal), thermal electric power generation, livestock watering, fish and wildlife habitat, and recreation. One especially significant category in the Upper Basin is transbasin exports, which averaged roughly 16.4% of total use between 2016 and 2020
How Thin is the Colorado River’s Safety Net?
Tree‑ring records and observed flows show that 2000–2024 is part of the driest multi‑decade stretch on the Colorado River in at least 1,200 years. Flows at Lees Ferry from 2000 to 2021 averaged about 84% of the 1906–2021 mean. Even with a few wet years mixed in, like 2023, the long‑term pattern is a persistent “megadrought” on top of rising temperatures that further cut runoff. In this context, Reclamation’s latest 24‑Month Study projects unregulated inflows to Lake Powell of about 4.95 MAF in water year 2026 under the most‑probable scenario. This is roughly 52% of the 30‑year average.
Storage has buffered that imbalance for more than two decades, but the cushion is now very thin. System‑wide live storage across the main Colorado River reservoirs is roughly 37% of capacity, down from about 95% at the turn of the century. Under the most‑probable projections, Lake Powell is expected to drop to around 3,488 feet by December 2026. This is just below the 3,490‑foot minimum power pool at which Glen Canyon Dam can reliably generate hydropower and release water through its turbines. The probable‑minimum scenario puts Powell closer to 3,470 feet, the lowest level since the reservoir first filled. In practical terms, small differences in inflow, on the order of 3–4 MAF in a single year, now determine whether the system inches away from crisis or toward emergency shortage declarations.
Changes in flow, allocation, and use mean the Colorado River is now managed on a very thin margin. Small shifts in snowpack, temperature, or demand can ripple quickly into shortages and conflicts. A durable path forward will depend on bringing legal promises back in line with what the river can realistically provide. As new post‑2026 rules are hammered out, the basin faces a real fork in the road. It can keep leaning on short‑term emergency fixes, or it can use this moment to build a more flexible, adaptive system that can survive a hotter, drier, and more volatile future.
Methodology
This study utilizes a comparative analysis of historical hydrologic records, legal frameworks, and basin-wide consumption reports to evaluate the widening gap between Colorado River supply and demand. The methodology is divided into three primary components:
Hydrologic Data Synthesis
The study analyzes annual natural flow data at Lees Ferry spanning the full period of record from 1906 to 2024. This historical baseline allows for a direct comparison between the long-term average flow of 14.6 million acre-feet (MAF) and the 21st-century “hot drought” (2000–2022), which is identified as the driest 23-year stretch in over a century. Primary flow data is sourced from the Bureau of Reclamation’s provisional records.
Legal and Allocation Review
We evaluate the “Law of the River,” focusing on the 1922 Colorado River Compact, the 1928 Boulder Canyon Project Act, the 1944 U.S.-Mexico Water Treaty, and the 1948 Upper Colorado River Basin Compact to quantify state-level and international entitlements. This framework is contrasted against physical availability as defined in the 2006 Consolidated Decree of Arizona v. California and the 1968 Colorado River Basin Project Act. By synthesizing these legal data points, the study identifies a “foundational over-allocation” totaling 16.5 MAF, which exceeds the actual long-term average supply.
Consumptive Use and Loss Assessment
Water consumption is categorized using two primary official datasets: the Upper Colorado River Basin Consumptive Uses and Losses Report (2016–2020) and the 2024 Lower Colorado River Water Use Report. Sector-specific demand—including irrigated agriculture (specifically cattle-feed crops like alfalfa and hay), Municipal and Industrial (M&I) use, and transbasin exports—is evaluated based on basin-wide assessments estimated between 2000 and 2019. The methodology also incorporates system losses, such as mainstream reservoir evaporation and channel loss, which are explicitly charged against state totals in the Upper Basin and quantified as a significant portion of the basin’s structural deficit.
By integrating these disparate data sources, the study quantifies the current structural deficit—where total consumption and losses (estimated at 19.3 MAF per year) consistently exceed natural runoff.
Additional Literature
- Long‑term flow and megadrought context
- Tree‑ring reconstructions and natural flow estimates for the Upper Colorado River Basin, including 2000–2021 flows at Lees Ferry and the 1,200‑year megadrought finding.
- Current and projected inflows and storage
- Bureau of Reclamation 24‑Month Study, “Most Probable” and “Probable Minimum” inflow and storage projections for Lake Powell and Lake Mead, March 2026.
- Colorado River Status Tracker and related basin‑wide storage summaries for current live storage as a percent of capacity.
- Recent megadrought summaries
- NOAA and university syntheses on the ongoing Western megadrought and its impact on Colorado River flows, snowpack, and temperature trends.
References / Key Sources
- Bureau of Reclamation. Colorado River Basin Natural Flow and Salt Data.
- Bureau of Reclamation. Upper Colorado River Basin Consumptive Uses and Losses Reports (including 2016–2020 datasets used in this analysis).
- Bureau of Reclamation. Colorado River Accounting and Water Use Report: Arizona, California, and Nevada (latest year used in this report).
- Bureau of Reclamation. 24‑Month Study projections for Lake Powell and Lake Mead, including Most Probable and Minimum Probable scenarios.
- Bureau of Reclamation. Supplemental Environmental Impact Statement and Record of Decision for Near‑Term Colorado River Operations (2024).
- Kuhn, Eric, and John Fleck. Science Be Dammed: How Ignoring Inconvenient Science Drained the Colorado River. University of Arizona Press, 2019.
- Schmidt, J. C., Yackulic, C. B., and Kuhn, E. “The Colorado River Water Crisis: Its Origin and the Future.” WIREs Water (2023).
- Schmidt, Jack, et al. Analysis of Colorado River Basin Storage Suggests Need for Immediate Action (September 2025).
- Schmidt, Jack, et al. Colorado River Reservoir Storage — Where We Stand (2025).
- Richter, Brian D., et al. research on Colorado River water use, livestock feed, and urban demand trends.