America’s Fast-Growing Cities Are Reducing Water Use
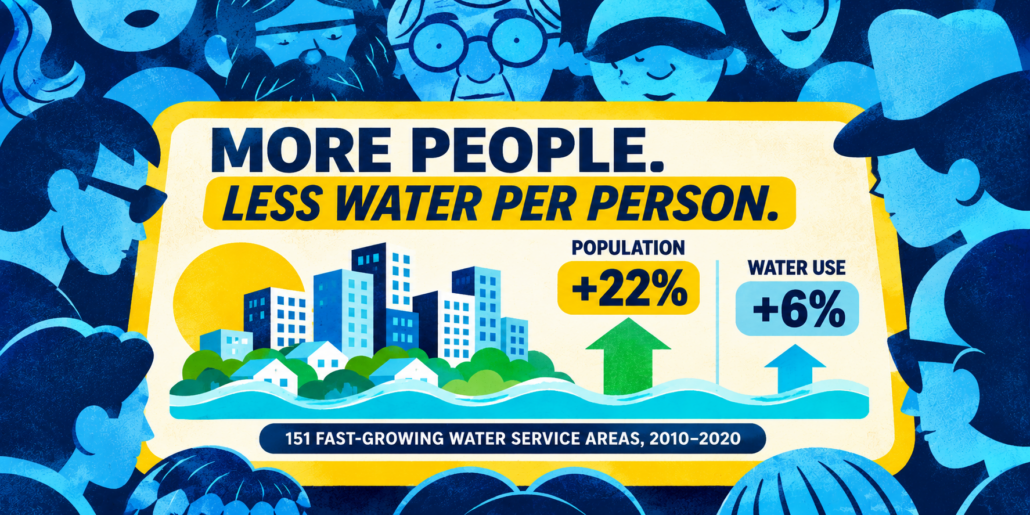
Many fast-growing U.S. cities and water service areas have added residents while keeping public-supply water use relatively flat or even reducing it. A new Healthy Green Spaces Coalition analysis examines 151 large public water service areas where population grew by at least 10% between 2010 and 2020, identifying communities that accommodated significant population growth without a corresponding increase in public-supply water demand.
Key Takeaways
- Population growth did not translate directly into proportional growth in public-supply water demand. Across the 151 large, fast-growing systems, estimated population increased 22.0% from 2010 to 2020, while average daily public-supply water use increased 6.0%.
- Declining per-resident water use was the norm. In 127 of 151 service areas, or 84.1%, per-resident water use declined over the decade.
- The strongest reductions were concentrated in the West. Of the 25 fast-growing service areas with the largest declines in water use per resident, 18 are located in Western states.
The analysis uses modeled public-supply water use and estimated service-area population to compare changes in water use per resident. Because public water service areas vary in their boundaries, customer mix, local water sources, economic activity, and system losses, the rankings are best understood as an indicator of broad trends rather than a precise like-for-like comparison of city water efficiency.
Where Population Growth Is Decoupled From Water Use
Many large systems in this analysis added residents faster than public-supply water demand increased. In the strongest cases, systems served more people while total modeled public-supply use fell.
The largest declines in water use per resident were often found in Western service areas, where water scarcity, drought exposure, high costs for new supply, and summer outdoor demand can create strong incentives for conservation. These systems may use a mix of pricing, landscape requirements, irrigation rules, leak reduction, water reuse, and other customer-efficiency programs to manage demand as populations rise.
The highest-ranked system was the Alderwood Water District service area in Snohomish County, Washington. From 2010 to 2020, estimated population increased 17.6%, while average modeled public-supply water use declined 29.8%. As a result, modeled water use per resident fell 40.3%.
Las Vegas offers another large-scale example. The estimated population served by the Las Vegas Valley Water District increased 41.8% from 2010 to 2020, while modeled public-supply water use declined slightly. Water use per resident fell 29.8%, the ninth-largest reduction among the systems analyzed. North Las Vegas Utilities showed a similar pattern: population increased 41.8% and modeled water use per resident declined 29.7%.
These figures do not mean that all uses or all customers reduced demand equally. They show that, at the service-area level, modeled public-supply water use grew more slowly than population or declined even as population increased.
Where Water Use Per Resident Is Still Rising
Not every fast-growing system followed this pattern. Twenty-four of the 151 service areas recorded increases in modeled public-supply water use per resident between 2010 and 2020.
The bottom-ranked systems show where growth is still adding water demand faster than efficiency gains can offset it. St. George, Utah, had the largest increase in the analysis. Its estimated service-area population grew 52.9% from 2010 to 2020, while modeled public-supply water use increased 122.0%. That pushed modeled water use per resident up 45.2%.
This pattern suggests that growth can add water demand faster than conservation, system improvements, or other efficiency measures can offset it. In fast-growing dry regions, new development, landscape irrigation, commercial activity, tourism, and changes in system operations may all affect public-supply demand trends.
The data do not identify the cause of a change in any individual system. A higher or lower ranking should therefore not be treated as a direct measure of utility performance. Instead, it shows where public-supply water demand changed faster or slower than population over the period analyzed.
What the Rankings Show
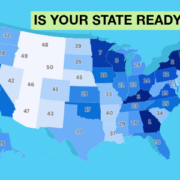
The results show that water-demand decoupling is increasingly common among large, fast-growing public water systems. Of the 151 systems included, most reduced modeled public-supply water use per resident from 2010 to 2020.
Some systems reduced per-resident use while total water use still increased. In those cases, population growth added demand, but water use rose at a slower rate than population. Other systems went further, adding population while total modeled public-supply use declined.
The full ranking also shows that public-supply water trends are highly local. Service areas in the same state can have very different outcomes. Climate, customer mix, commercial and industrial demand, water prices, conservation programs, water losses, development patterns, and service-area boundaries can all shape a system’s results.
Rather than treating the rankings as a definitive comparison of cities, the analysis is most useful for identifying places where public-supply water use and population growth are moving in different directions. These service areas may offer useful case studies for understanding how fast-growing communities manage demand without relying solely on additional water supply.
Irrigation Expertise Is Concentrated in a Few States
The analysis also compares water-use trends with the local availability of EPA WaterSense-certified irrigation professionals. This comparison is exploratory and does not establish that irrigation expertise causes lower water use.
Among the systems with the largest declines in modeled water use per resident, the median service area had 13 certified irrigation professionals within 50 miles. Among the systems with the largest increases, the median was 8 professionals.
This difference should be interpreted cautiously. Irrigation professionals and water-efficiency programs are both more common in parts of the West, where climate, water scarcity, and landscape practices also differ from other regions. Some high-performing systems have relatively few nearby professionals, while some systems with more professional capacity still experienced rising per-resident use.
Still, irrigation expertise may be one part of a broader local conservation infrastructure. Certified professionals can audit irrigation systems, identify leaks and overspray, review controller settings, match equipment to site conditions, and improve seasonal watering schedules. Alongside utility programs, landscape standards, pricing, and water-smart technology, this expertise can help communities reduce unnecessary outdoor demand.
Methodology
Healthy Green Spaces Coalition analyzed data on monthly public-supply water use by water service area from 2010 to 2020 from the U.S. Geological Survey. The USGS data are modeled estimates of total public-supply water use, measured in million gallons per day, for public and private water suppliers. The estimates include water supplied for domestic, commercial, industrial, public and system uses, as well as water consumed or lost within the public-supply system. Annual 2010 and 2020 values were calculated as average daily water use across the 12 monthly estimates.
Historical population by water service area was calculated using gridded population rasters from NASA Earthdata. Data was aggregated from population grids to water service area boundaries from the EPA for 2010 and 2020. The final universe included water service areas with reported population served of at least 100,000 residents, estimated population growth of at least 10% from 2010 to 2020, and gridded 2020 population estimates within 25% of reported population served counts.
Water use per resident was calculated as annual average public-supply water use divided by estimated service-area population. Rankings are based on the percentage change in water use per resident from 2010 to 2020. Data on certified irrigation professionals by city is from the EPA WaterSense directory and was joined to water service areas using a 50-mile buffer.