


How Far Below Normal Is the Great Salt Lake’s Water Level Today?
A new analysis by Healthy Green Spaces Coalition measured how far the Great Salt Lake has fallen from its long-term historical baseline. The data shows a persistent gap between the lake’s pre-2000 average and its modern reality that cannot be explained by drought alone.
The analysis uses monthly USGS elevation data from April 1966 through November 2025, covering 715 observations at the Great Salt Lake’s Saline, Utah gauge.
Key Takeaways
- From 1966 through 2025, the Great Salt Lake’s long-running mean elevation was about 4,197.4 feet above sea level (ASL), but since 2000 it has averaged only 4,194.2 feet ASL, a gap of roughly 3.2 feet.
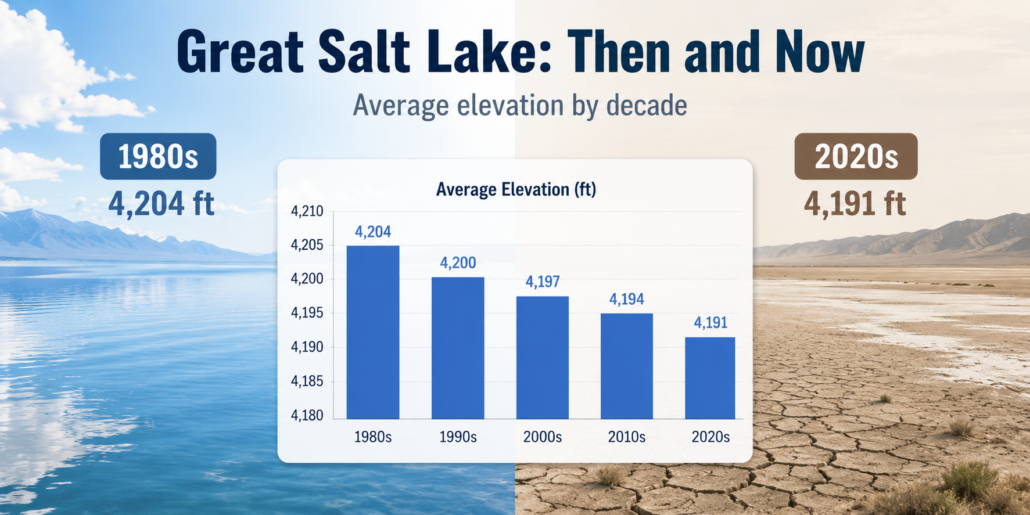
- The 2020s are running at an average of about 4,191.0 feet ASL, and 13.2 feet below the 1980s average of 4,204.3 feet ASL.
- The five highest annual average years on record are all from the 1980s, while four out of the five lowest years are from 2020 and 2025.
Great Salt Lake Elevation Over Time
The Great Salt Lake is terminal or endorheic, meaning it has no outlet, is the largest saltwater lake in the Western hemisphere and the 8th largest of its kind in the world. Its surface elevation is defined by watershed inflows and depletions from evaporation.
This study uses monthly elevation data from the USGS Great Salt Lake Saline, UT gauge covering April 1966 through November 2025, yielding 715 monthly observations. Elevations are reported in feet above mean sea level.
Across this full record, the lake’s long‑run mean elevation is approximately 4,197.4 feet. In the late 20th century, particularly the 1980s, the lake often stood several feet above this baseline. Today, it sits several feet below it. The shift is persistent enough that the modern lake can reasonably be described as operating in a different hydrologic regime than the one that defined most of the post‑war era. Due to ongoing drought and upstream diversions the Great Salt Lake is 36% full, has approximately 1,000 square miles exposed lakebed – representing more than half of its historic footprint, and is over 6 feet below the minimum healthy level.
Google Earth Time-lapse of the Great Salt Lake since 1984
The Structural Gap: Historical Baseline vs. Modern Reality
Over the full 1966–2025 record, the average lake elevation is about 4,197.4 feet, but from 2000 onward the average drops to roughly 4,194.2 feet. That 3.2‑foot shortfall represents a long‑term structural shift rather than a transient drought signal, since it persists across multiple wet and dry years.
Key figures from the time series:
- Long‑run mean (1966–2025): 4,197.4 ft.
- Post‑2000 average: 4,194.2 ft (3.2 ft below the long‑run mean).
- Record monthly high: 4,211.2 ft in April 1987.
- Record monthly low: 4,188.6 ft in November 2022.
Peer‑reviewed hydro‑climate studies published by Wayne Wurtsbaugh and colleagues in leading water‑resources journals estimate that upstream consumptive use has reduced inflows by roughly 39 percent, lowering the lake by about 11 feet and reducing its volume by roughly half over the course of decades as upstream water use expanded. That physical water‑balance work aligns closely with what the elevation record shows: a lake that has been systematically drawn down below the historical norm as human water use expanded.
The Decade‑by‑Decade Staircase
Looking by decade highlights a clear shift. Using monthly data grouped by decade, the lake’s average elevation comes out to approximately:
The 1980s stand out as an exceptionally high‑water decade, driven by a run of extreme snowpack years in the upper watershed. The 2020s average sits roughly 13.2 feet below that 1980s high, meaning the typical lake level today is more than a dozen feet lower than the conditions that shaped late‑20th‑century infrastructure and ecosystems.
Using bathymetric relationships (the mathematical and physical connections between depth, surface area and volume of water) from USGS and Strike Team work, an interdisciplinary group of Utah researchers advising the state on lake recovery, each foot of elevation change corresponds to on the order of a million acre‑feet of water for the southern arm. That implies the 13.2‑foot gap between the 1980s and the 2020s corresponds to a multi‑million‑acre‑foot reduction in stored water.
Highest vs. Lowest Years
Examining annual mean elevation underscores how tightly the extremes cluster in time. The five highest annual mean years in the record all occurred in the 1980s:
- 1987 — 4,210.2 ft.
- 1986 — 4,210.0 ft
- 1985 — 4,208.5 ft.
- 1988 — 4,207.7 ft.
- 1984 — 4,205.6 ft.
By contrast, the lowest annual averages cluster in the recent record:
- 2023 — 4,189.3 ft.
- 2022 — 4,189.7 ft.
- 2016 — 4,190.2 ft.
- 2021 — 4,191.2 ft.
- 2024 — 4,191.4 ft.
The 2022–2025 Trough and Partial Rebound
The system’s recent evolution follows a familiar pattern: a structural deficit that produces extreme lows, followed by a partial recovery when snow returns. USGS data and the Strike Team’s 2026 summary indicate that the southern arm reached a record low of 4,188.5–4,188.6 feet in late 2022, then remained near that floor through much of 2023. Annual mean elevations were approximately 4,189.7 feet in 2022 and 4,189.3 feet in 2023, the lowest in more than a century of record keeping.
Heavy snowpack in 2023 and 2024 delivered a modest rebound. Annual mean elevations rose to roughly 4,191.4 feet in 2024 and about 4,191.8 feet in 2025 based on available months. That recovery is meaningful, but it still leaves the lake roughly 5.6 feet below its long‑run average and around 6–7 feet below the 4,198‑foot minimum healthy level identified by scientists.
The Great Salt Lake Strike Team and supporting analyses estimate that restoring the lake to 4,198 feet would require roughly 800,000 acre‑feet of additional net inflow every year, sustained for about a decade, to reach that level by 2034.
From Hydrologic Variability to a New Low Regime
Historically, the Great Salt Lake oscillated around a higher center point, with large interannual variability reflecting the swings in mountain snowpack and temperature. In the 1980s, those oscillations pushed the lake to record highs; since 2000, they have played out around a much lower mean. The decadal “staircase” — climbing into the 1980s and then descending step by step into the 2020s — is consistent with a system where upstream depletions have ratcheted up over time while natural hydrologic variability continues on top of that trend.
Peer‑reviewed work by Wurtsbaugh, Null, and colleagues concludes that human consumptive use accounts for the majority of the lake’s decline, with climate change (via increased evaporation and altered runoff timing) playing a smaller but growing role. Agriculture remains the dominant consumer, and recent research indicates that roughly 70 percent or more of human‑caused depletions are tied to irrigated agriculture, with about 80 percent of that agricultural water going to alfalfa and hay for cattle feed.
Methodology
This study relies on USGS elevation data from the “Great Salt Lake gauge, Saline, UT” and associated Great Salt Lake Hydro Mapper, covering April 1966 to November 2025. Elevations are reported in feet above mean sea level and represent conditions in the lake’s southern arm, which is the primary focus of most ecological and economic analyses.
Monthly values are used to compute:
- Long‑run mean: arithmetic mean of all 715 monthly observations.
- Annual means: arithmetic mean of all monthly observations within a given calendar year.
- Decadal means: arithmetic mean of all monthly observations falling within each ten‑year period (e.g., 1980–1989).
- Monthly climatology: arithmetic mean of all observations for each calendar month across the full record.
The “minimum healthy level” of 4,198 feet follows the consensus adopted by the Great Salt Lake Strike Team and cited across Utah State University and University of Utah work, which link that threshold to brine shrimp habitat, migratory bird use, and dust suppression. Estimates of the inflow required to reach that elevation are taken from Strike Team reports and associated policy briefs.
Together, these methods align with the structural‑deficit framing used in prior Green Spaces Coalition work on the Colorado River, substituting lake elevation for river flow and focusing on the gap between historical norms and the modern, depleted regime.