Why a Wet Winter Can Still Leave the West at Risk of Drought?
How can we get rain in the winter and still be at risk of a drought?
This is a paradox of sorts. A warm rain paradox.
Key Takeaways
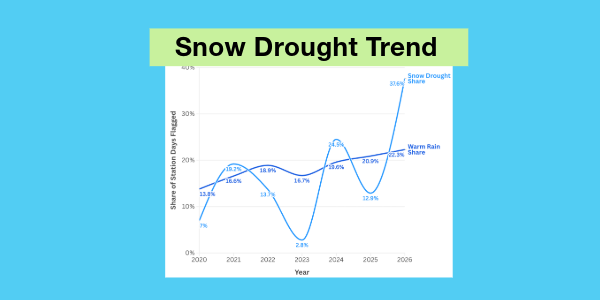
- This winter, December and January recorded 37.6% of snow drought days. This is the highest value in the six years we analyzed.
- Over the last six winters, warm‑rain‑type winter storms have become more common in this record. In December–January, the warm‑rain share rises from about 17% in 2021 to about 22% in 2026, the highest of the six seasons.
- In Washington’s December–January 2026, warm‑rain share roughly doubles (typically 7% now up to 15%), while snow‑drought share tripled (from 21% to 63%), meaning many wet days arrived too warm to reliably build the snowpack.
A warm snow drought occurs when near-normal precipitation falls, but warm temperatures cause it to rain, preventing snow pack accumulation. Indeed, in 2025 many Western states had their warmest December on record.
This paradox sparked our interest, and our research team decided to analyze publicly available data on this topic. We found that Western states may be at a higher risk of drought than they realize.
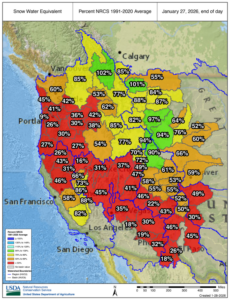
We assessed data from the USDA’s Natural Resources Conservation Service (NRCS) Snow Telemetry (SnoTel) sites, which capture real-time data including Snow Water Equivalent (SWE) to forecast water supply, monitor drought, and manage flood control.
Regionally, there are over 900 automated remote sensing stations across 13 states, which collect over 3 million observations, showing that as of January, 2026 snow was thinner than at any previous January over the past 6 years.
For Jon Meyer, Ph.D., Assistant State Climatologist, Utah Climate Center, “this is really a bellwether moment that exposes that this is no longer a projection on the horizon, that these kinds of years present real, tangible impacts to the West’s ability to sustain population growth and economic security in the future.”
What is a Snow Drought?
The NRCS defines a snow drought as “snow water equivalent (SWE) at or below the 20th percentile, which is a baseline guided by partner expertise and research.”
Think of “snow” like a savings account. When snow falls and stays cold, you’re saving water for later. But if it rains on top of that snow, the snow melts and runs off immediately. At the state level, “for Utah, with a 30% of median, you could say this is the lowest it’s ever been. It’s never been below,” warned Meyer.
You can have lots of winter precipitation, yet still end up with a higher drought risk later in the year, because the water never stays stored as snow. “So getting a gallon of rainfall in January is certainly not the same as a gallon of snow water that’s kept through April or May”, underlined Meyer.
This can create a few problems for reservoirs.
- Reservoirs can fill faster in winter, forcing managers to release water for flood control or because they are at capacity
- Late spring and summer inflows can drop sharply, with no water to refill reservoirs as the water is used.
Even if total annual precipitation is high, reservoirs can have less water when it’s needed.
What Did We Find?
2026 is shaping up as a high snow-drought risk year in the Western United States. This winter saw the highest snow‑drought rate in six years, about 37.6% of station reports, alongside a rise in warm‑rain storms, which grew from roughly 17% in 2021 to 22% in 2026.
When snow is already thin this early in winter, there’s much less margin for recovery later.
“The trends that have played out over the last 6 years, I think, are representative of the direction that we’re going. Right now, the current state of things is maybe the most egregious example of where we suspect the West’s hydroclimate is headed,” explained Jon Meyer. “You can see on this graphic right here, the most recent year is just an insane jump up in the snow drought share. We see that long-term trend upward in the warm rain share. I can say anecdotally that this matches kind of the long-term trends that we see when we look back over the last 45 years of snow observations, here in Utah at least.“
To see how this plays out on the ground, we looked at each state individually.
Data by State
This state data shows which states are saving winter water as snow, and which are quietly losing it before summer even starts. It summarizes how winter precipitation, snowpack, and snow drought differ by state, using the same definitions across the Western U.S. and nearby regions.
- The warm‑rain share tells us how often winter precipitation shows up without really building snowpack at a station.
- The snow‑drought share tells us how often snowpack is unusually low for that time of year, compared with what that same station usually sees.
- The thin‑snowpack share tells us how often snowpack is meaningfully below normal even if it doesn’t meet the snow‑drought threshold, a useful early warning for reduced spring runoff.
To make the table easier to compare across states, we combine these into a Drought Risk Score (0–100), where higher scores mean a larger share of station‑days showing snow drought and/or thin snowpack, with a smaller added contribution from warm rain. The score is a single number that summarizes how “snow-stressed” a state looks heading into spring, using the December 2025 – January 2026 conditions at stations in that state.
All data dates range from December ‘25 to January ‘26.
Washington
From December 2025 through January 2026, warm‑rain conditions were roughly twice as common as in a typical winter, and low‑snow conditions were roughly three times as common. In other words, it was wetter and warmer, but far less of that moisture ended up stored in snowpack.
Oregon
Shows the same pattern as Washington, with more warm‑rain conditions and a large jump in low‑snow conditions, a clear warm‑rain‑paradox signal.
Idaho
Also follows the Northwest pattern: both warm‑rain share and snow‑drought share rise sharply from December 2025 through January 2026
California
Warm‑rain and low‑snow shares both increase from December 2025 through January 2026, but the changes are smaller than in Washington and Oregon.
Colorado
Low‑snow share rises but the warm‑rain share stays about the same, so this winter looks snow‑poor for reasons other than more warm‑rain‑type conditions.
Utah
Warm‑rain share and snow‑drought share both go up, suggesting that warmth and storms together are thinning the snowpack.
Nevada
Similar to Utah, with higher warm‑rain and low‑snow shares in Dec–Jan 2026 compared with its usual winters.
Wyoming
Only modest changes, with snow‑drought share ticking up a bit while warm‑rain share stays close to normal.
Montana
December 2025 through January 2026 looks roughly in line with its typical pattern; neither warm‑rain nor low‑snow shares change much.
Arizona
Very high warm‑rain share and elevated low‑snow share, but many stations are in naturally warm, low‑snow areas, so “rain with little snow” is common even in normal years.
New Mexico
Similar to Arizona, with lots of warm‑rain‑type conditions and thin snow, but in a region where snowpack is already limited in many locations.
Across the Western U.S., the pattern is clear: where winters are both wetter and warmer, snowpack is struggling. In places like Washington, Oregon, Idaho, Utah, Nevada, and parts of California, more storms are arriving in a warm mode and lining up with much higher shares of low‑snow conditions, a strong sign of the warm rain paradox at work. Elsewhere, like Colorado or the Southwest, thin snow shows up for different reasons, reminding us that not all snow droughts look the same—but the end result is similar: less reliable snow “savings” to carry water into the spring and summer.
What This Means for Water and Landscapes
The takeaway is straightforward: how warm winter storms are matters as much as how much precipitation falls. In a warm winter, a season can look wet on paper but still behave like a drought year for rivers, lakes, and reservoirs. That’s because less water is stored as snow and more runs off right away.
This can lead to:
- Water arriving earlier in the year,
- More flooding driven by rain instead of slow snowmelt, and
- Less water later in spring and summer, when demand is highest.
For outdoor water use and green spaces, this points toward more resilient choices:
- Water-wise landscapes that can handle heavy winter rain and dry summers,
- Low-water grass seed and drought-tolerant plants that need less irrigation overall,
- Efficient irrigation, since snowpack is a less reliable water “savings account,” and
- Planning for bigger swings from year to year, not just simple wet vs. dry seasons.
Overall, winters like this one may become more common in the future. As Jon Meyer put it, “The expectation with climate change is that these conditions will continue to amplify and accelerate. That’s just a result of the natural feedbacks that are taking these initial nudges to the hydroclimate and rolling with them, and sort of amplifying them. And so we see those kind of feedbacks playing out in soil moisture, we see them playing out in the timing of spring runoff.”
Important note: This analysis does not predict outcomes on its own. It shows patterns worth paying attention to, not final answers.
Bottom line:
These results raise important questions about how we manage water and landscapes in a warmer world—but they are a starting point for discussion, not a final verdict.
Methodology
Data source and methods
All of the snow, precipitation, and temperature data in this study come from the USDA NRCS Automated Water Data Base (AWDB) web services. We used the public AWDB REST API. For this analysis, we extracted monthly records (snow water equivalent, snow depth, precipitation, and temperature) for all available stations in the network for the last 6 years, then aggregated station-month observations to create the state and station metrics described in the methodology.
The Data We Used
We used monthly records from NRCS snow and climate stations in the U.S. and nearby provinces. For each station, we have:
- SWE (WTEQ) – how much water is stored in the snowpack (inches)
- Snow depth (SNWD) – how deep the snow is
- Precipitation (PREC) – how much water equivalent fell
- Temperature (TOBS) – monthly temperature
- A state- and network-code for each station
Shares of Snow‑Drought per December – January Season
To see how the warm rain paradox shows up over time, we pulled the core AWDB monthly variables to build two simple monthly proxies. We flagged a month as snow drought when that station’s SWE fell at or below its historical 20th percentile for that same calendar month, computed from our 2020–2026 data.
We look only at December and January each year, so we’re always comparing the same part of winter. For each season, we use shares, not raw counts:
- Share = (months flagged) ÷ (all station-months in that window).
- This keeps things fair when some years have more stations reporting than others.
Snow-Drought (thin snow for the time of year)
We flag a station-month as a snow drought when SWE is unusually low for that station in that calendar month. Concretely, for each station and each month of the year, we compute the station’s 20th percentile SWE over the last 6 years. If that station’s SWE for that month is at or below its 20th percentile threshold, we flag it as a snow drought.
This matches the common “20th percentile” snow-drought framing while keeping the baseline station-specific, so we can compare stations fairly without external climate-normal products.
Warm-rain conditions
We also flag a station-month as a warm-rain proxy when precipitation is present but the station shows little or no snowpack signal for that month. This is a practical proxy for “winter moisture that is less likely to become stored snowpack,” without claiming we directly observe rain-versus-snow phase or rain-on-snow melt.
Aggregation to state and regional metrics
After flagging station-months, we aggregate those flags into state-level and network-wide shares for each Dec–Jan season. Those shares are what we use in the charts and comparisons over time.
Drought Risk Score (0–100)
The score is a single number that summarizes how “snow-stressed” a state looks heading into spring, using the Decmber–January 2026 (DJ26) conditions at stations in that state.
We build it from three shares in your table:
- DJ26 snow drought share (how often stations were in snow drought)
- DJ26 thin snowpack share (how often stations had unusually low snowpack)
- DJ26 warm rain share (how often precipitation fell as rain in conditions that are risky for snow storage)
Because spring water supply depends most on how much snow is missing, we weight the snow metrics more than warm rain:
Risk (0–100) = 100 * [0.55*(snow drought share) + 0.35*(thin snowpack share) + 0.10*(warm rain share)].
Weighting rationale
The score is built so missing snow counts much more than warm storms: 0.55 for snow drought, 0.35 for thin snow, and 0.10 for warm rain. This mirrors other drought indices that treat snowpack or SWE as the main signal for winter water supply, while temperature- and rain-related factors mostly matter for how they erode or fail to build that snow.
In other words, the weights are tilted 90/10 toward “how much snow is missing” versus “how often storms arrive too warm,” which is consistent with how composite drought tools emphasize water stored as snow over the specific weather pattern that caused the loss.
How to interpret it
A score of 0 would mean none of these risk conditions showed up at stations in that state during Dec–Jan 2026. A score of 100 would mean stations were always in these risk conditions (which is practically unlikely). In plain terms, higher score = more widespread station-days showing snow drought and/or thin snowpack (plus some added risk from warm rain), so higher concern for spring runoff and water supply.
Limitations
- The score is descriptive, not predictive: it summarizes December–January conditions and does not forecast spring runoff or reservoir levels.
- Our baseline covers only six winters (2020–2026), so the 20th-percentile thresholds are less stable than those drawn from a 30-year climate normal.
- Station density varies by state, so states with fewer stations (e.g., Arizona, New Mexico) may show more volatile shares.


