Which States Are The Most Drought Resilient?
A new report by Healthy Green Spaces Coalition estimated each U.S. state’s drought resilience. The data shows how vulnerable states are to droughts based on their residential and total water usage (including agricultural).
The ranking is calculated based on per-capita domestic usage, per-capita total withdrawals (i.e., total gallons of water used per day in the state), and drought severity.
- Drought exposure varies widely across states. Arizona’s long-term drought severity index is about 6.3, the highest nationally, while Alaska’s is about 0.07, rarely experiencing drought.
- Overall, the most resilient state combine below-expected per-capita use with favorable drought profiles. Georgia is ranking #1 with an 85 resilience score on a 0-100 scale.
- The rest of the top five, New York (84.7), Kentucky (84.7), Rhode Island (84.4), and Connecticut (83.6), share a similar profile of low per‑capita use, relatively modest drought severity, and solid water‑efficiency policy signals.
- Residential and commercial efficiency leaders such as Connecticut (35 gallons per person per day), Vermont (43), Maine (51), Minnesota (55), and Pennsylvania (56) indicating that domestic demand can stay below 60 gallons per person per day in the most efficient states.
- Gaps between leaders and laggards are driven largely by outdoor and systemwide use. Washington’s total withdrawals are 553 gpd per capita versus Wyoming’s 14,111 gpd per capita, a difference of about 25-fold.
The resilience score is based on 1 – 100, with states scoring a 100 having high resilience and 0 having low resilience.
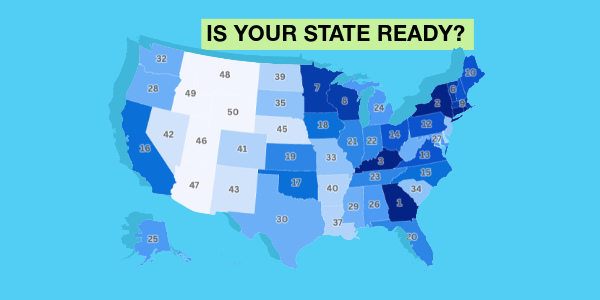
Ranking States by Drought Resilience
The map ranks each state based on which is the most resilient, with Georgia ranked #1 as being the most resilient, and Wyoming being the least resilient in position 50.
Top 5 States
- Georgia: 85.1 — Strong policy score plus balanced domestic use and withdrawals, with manageable drought exposure
- New York: 84.7 — Low per‑capita demand and robust policy signals; drought exposure is relatively modest
- Kentucky: 84.7 — Very favorable drought severity and restrained withdrawals per capita, with steady household use
- Rhode Island: 84.4 — Excellent domestic efficiency and low withdrawals; drought exposure remains limited
- Connecticut: 83.6 — Best‑in‑class household efficiency and low overall withdrawals with stable drought conditions
Bottom 5 States
- Wyoming: 12.6 — Very high withdrawals per capita overwhelm the score despite other factors
- Idaho: 29.1 — Elevated withdrawals per capita with limited policy offset and persistent drought exposure
- Montana: 42.4 — High normalized withdrawals per capita and moderate drought pressures dampen resilience
- Arizona: 43.2 — Severe drought exposure combined with elevated demand lowers overall resilience
Utah: 47.8 — Higher withdrawals per capita and sustained drought conditions keep the score down_
Top 5 States
- Georgia: 85.1 — Strong policy score plus balanced domestic use and withdrawals, with manageable drought exposure
- New York: 84.7 — Low per‑capita demand and robust policy signals; drought exposure is relatively modest
- Kentucky: 84.7 — Very favorable drought severity and restrained withdrawals per capita, with steady household use
- Rhode Island: 84.4 — Excellent domestic efficiency and low withdrawals; drought exposure remains limited
- Connecticut: 83.6 — Best‑in‑class household efficiency and low overall withdrawals with stable drought conditions
Bottom 5 States
- Wyoming: 12.6 — Very high withdrawals per capita overwhelm the score despite other factors
- Idaho: 29.1 — Elevated withdrawals per capita with limited policy offset and persistent drought exposure
- Montana: 42.4 — High normalized withdrawals per capita and moderate drought pressures dampen resilience
- Arizona: 43.2 — Severe drought exposure combined with elevated demand lowers overall resilience
- Utah: 47.8 — Higher withdrawals per capita and sustained drought conditions keep the score down
Detailed State Scoring
The table below shows the water and drought data used in calculating the resilience score. Drought severity reflects the average weekly share of a state in US Drought Monitor categories weighted by intensity over the past 12 months, scaled so lower values mean less drought and higher values mean more. Residential use per capita is the gallons of water used per day for household use, and total withdrawals are the gallons per day for the entire state.
The AWE points system assesses each state’s adoption and implementation of laws and policies promoting water efficiency, conservation, sustainability, and affordability. The drought score is from 0 – 100, with 0 being the least resilient and 100 being the most. Drought severity, residential use per capita, and total withdrawals per capita each represent 30% of the score, while AWE points represent 10%.
Residential and Commercial Water Efficiency
We ranked states by total daily domestic (residential and commercial) water use in gallons per day (GPD) per capita. Lower use reflects stronger conservation and efficiency programs.
Top 5 States
- Connecticut: 35 GPD per capita
- Vermont : 43 GPD per capita
- Maine: 51 GPD per capita
- Minnesota : 55 GPD per capita
- Pennsylvania: 56 GPD per capita
Bottom 5 States
- Idaho: 184 GPD per capita
- Wyoming: 179 GPD per capita
- Utah: 169 GPD per capita
- Arizona: 145 GPD per capita
- Hawaii : 144 GPD per capita
Total Water Withdrawals
We ranked states by daily total withdrawals, covering all uses, in million gallons per day (MGD). Lower values signal lower demand on local water sources and ecosystems.
Top 5 States (Lowest Withdrawals)
- Vermont: 90.9 MGD
- Rhode Island: 343 MGD
- South Dakota: 400 MGD
- Delaware: 790 MGD
- Alaska: 766 MGD
Bottom 5 States (Highest Withdrawals)
- Illinois: 10,500 MGD
- Michigan: 10,100 MGD
- Texas: 21,300 MGD
- Florida: 15,300 MGD
- California: 28,800 MGD
Drought/Water Stress
What the data show:
Drought severity measures long-term water stress, weighted by intensity, based on weekly data over the last 12 months. Identifies states where scarcity is most severe.
Top 5 States (Least Stress)
- Alaska: 0.07 — Rare drought events
- Louisiana: 0.32 — Abundant rainfall, minimal dry spells
- Kentucky: 0.35 — Stable climate, low drought
- Mississippi: 0.69 — Reliable rainfall
- Florida: 1.50 — Only moderate drought despite demand
Bottom 5 States (Most Stress)
- California: 2.19 — Historic, persistent droughts
- Montana: 2.84 — Episodic severe drought
- Utah: 3.48 — Water scarcity a constant challenge
- New Mexico: 4.46 — Prolonged regional aridity
- Arizona: 6.31 — Highest exposure, chronic conditions
Our study shows that drought resilience is driven more by management than by climate alone. States like Georgia and Washington demonstrate that below‑expected domestic and total withdrawals per capita can coexist even under measurable drought pressure. Conversely, lagging states tend to pair high per‑capita withdrawals with limited adoption of outdoor efficiency practices.
DATA: https://docs.google.com/spreadsheets/d/1YnuDq2jJXi9Z15V1l5f-BxWHjXUXbAhFmLv2DgAu-lY/edit?gid=0#gid=0
Methodology
Data Sources and Scope:
Data were compiled into a unified state-level set integrating recent USGS and proprietary models. Metrics include domestic water use (MGD), total daily withdrawals (MGD), and a normalized drought severity index. All 50 states are ranked.
Primary Data Sources:
- USDA NASS QuickStats Irrigation and Water Use Database
(https://quickstats.nass.usda.gov/results/A698CD69-7F8C-3908-BC3B-9EC58096837B) - U.S. Drought Monitor Comprehensive Statistics
(https://droughtmonitor.unl.edu/DmData/DataDownload/ComprehensiveStatistics.aspx) - U.S. Geological Survey Water Use Circular 1441
(https://pubs.usgs.gov/publication/cir1441) - AWE 2022 State Policy Scorecard for Water Efficiency and Sustainability (https://allianceforwaterefficiency.org/wp-content/uploads/2023/01/AWE-2022-Scorecard-Full-Report-1.pdf)
How Our Drought Resilience Scoring Works
What we measure
We use three raw, per‑state metrics from the study: drought severity, domestic water use per capita (GPCD), and total withdrawals per capita (GPCD). Lower values are better for all three. We also use AWE 2022 State Policy Scorecard for Water Efficiency and Sustainability.
How we score
Each metric is normalized the same simple way using inverted min‑max scaling so that lower raw values map to higher scores on a 0–1 scale. Drought severity, domestic water use per capita (GPCD), and total withdrawals per capita, each account for 30% of the final score, while the policy scorecard points account for 10%.
What the score means
The composite reflects states that simultaneously have lower drought severity, lower domestic use per person, lower total withdrawals per person, and stronger policy after normalization. Higher scores indicate stronger overall drought resilience driven by lower demand and lower exposure.


